Microsoft Clarity: a new and free website analytics tool
New metrics, recordings and heatmaps to help you understand what a visitor does on your website
Microsoft Clarity is a new and free web analytics tool that allows you to get deeper insights of your website user’s behaviour. It was launched a couple of weeks ago and is beginning to get some attention from the online marketing insiders. It offers features for free that other online analytics tools don’t. The tool is organized around three major components: a dashboard, session recordings and heatmaps.
Starting with Microsoft Clarity
Setting up Microsoft Clarity is easy. You simply go to clarity.microsoft.com and click either ‘Sign in’ or ‘Get started’. You can sign in with your Microsoft account, Facebook account or Google account. Choose ‘Add new project’ to launch your first project. Simply fill out the name of your project and the website in question. The site category is optional.
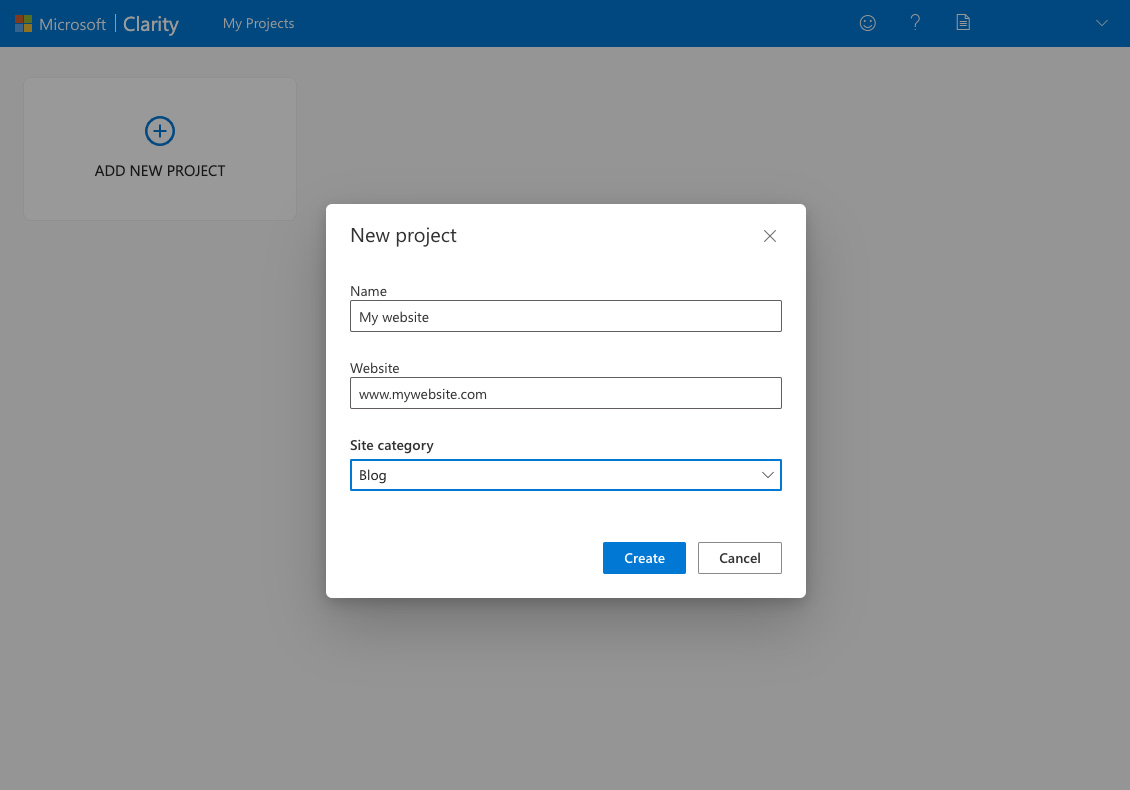
The next step is to add a tracking code to your website, exactly as you do with Google Analytics, HotJar or a Facebook Pixel. Go to ‘settings’ in your Microsoft Clarity interface where you can find the snippet. You can add it manually or through a third-party platform like Google Tag Manager. If you add it manually, put it in the <head> section of your site. The more professional way is to add it via Google Tag Manager. If you use this already, it will be twice as simple:
- Go to your Google Tag Manager account and select the container for the site you want to add the Microsoft Clarity code for
- Choose ‘new tag’ and select ‘custom html’ as tag type
- Copy/paste the tracking code
- Choose ‘all pages’ as the trigger type
- Submit the changes
That’s it. Again: this mode of operation will be all too familiar if you are acquainted with other measuring tools. If this is new for you, familiarize yourself with Google Tag Manager as quickly as possible.
- Read More: How to set up Google Tag Manager
Exploring the the dashboard
Now that you have added the tracking code to your website, metrics will be coming in. Do note it can take up to two hours before you see statistics in your dashboard.
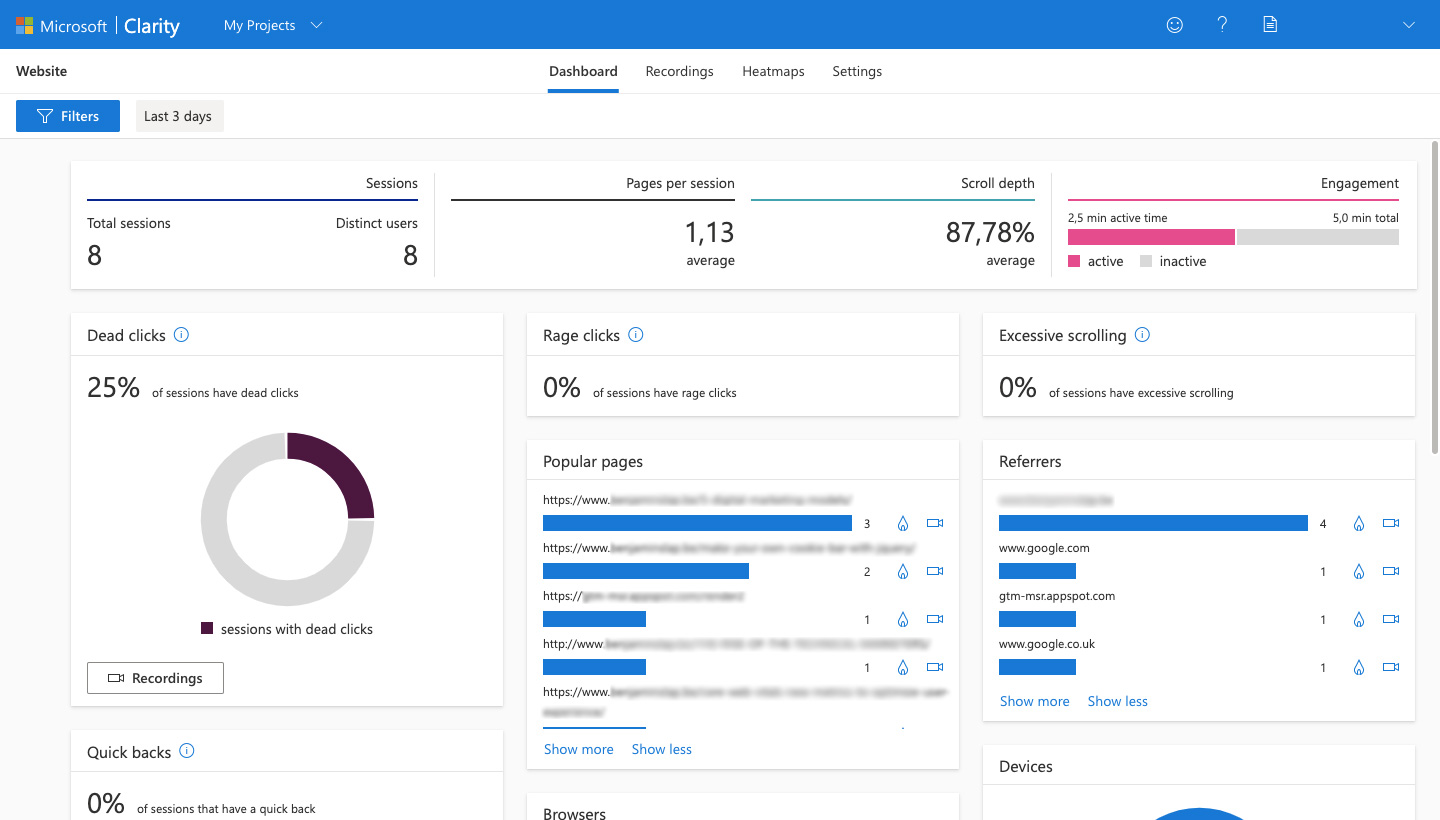
You can see immediately that the lay-out is quite minimal, not as elaborated as let’s say Google Analytics. On top of your screen you have some well-known metrics like Sessions and Pages per session. But some intriguing statistics draw attention:
- Scroll depth: this gives you an idea how far visitors scroll on your site
- Engagement: a metric that is gaining popularity. More and more analytics tools attribute importance to this. The new Google Analytics 4 also puts this into the centre.
- Dead clicks: a click on ‘blank’ area of your page. E.g. not on a link.
- Rage clicks: a metric that indicates if a user clicked multiple times on a small area of your page. This can be a sign of poor visualization of an element.
- Excessive scrolling: when someone scrolled through a page more than expected.
- Quick Backs: comparable to pogo sticking in organic search results. A user lands on a page and almost immediately returns to the previous page. This can mean that the visitor expected certain content on a page after clicking a link but was lef disappointed when he arrived on that page.
Recordings
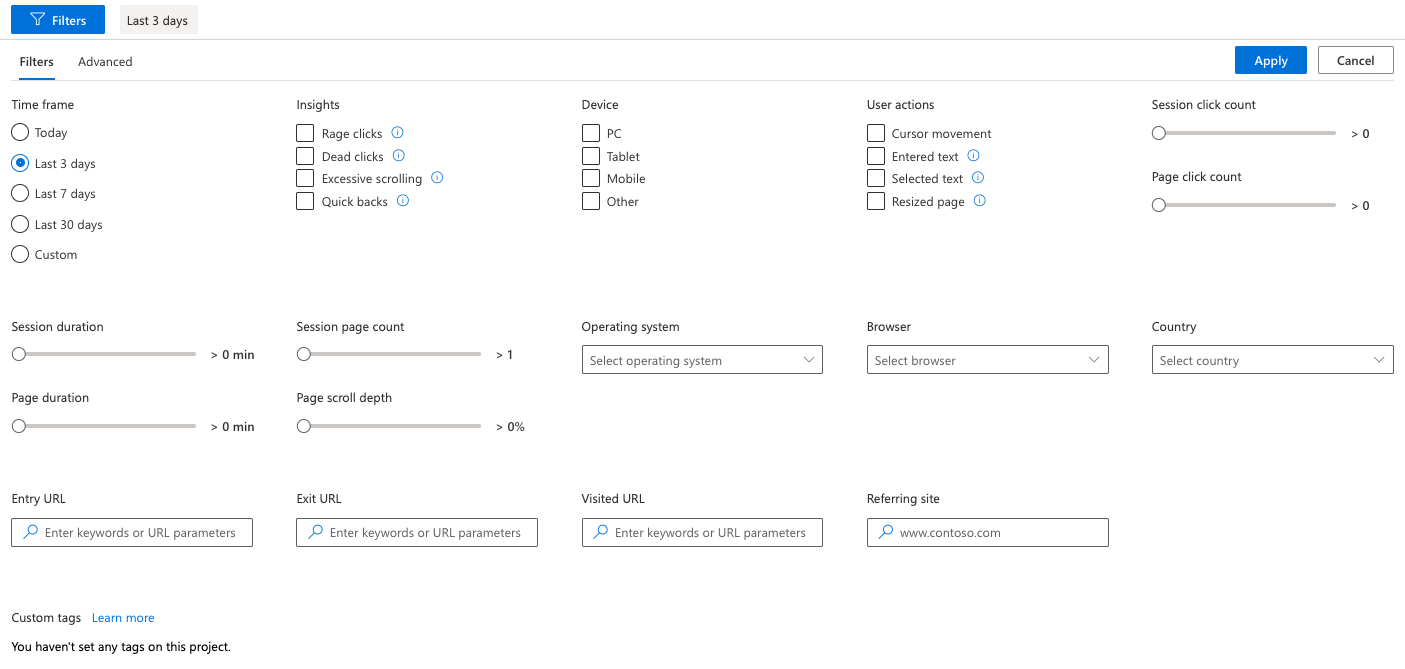
Microsoft Clarity allows you to look at records it makes from page visits. This can give you valuable information about user behaviour. It keeps recordings of all sessions so you can look at them at a later date. You can also apply a whole range of filters on these recordings to go into detail.
Heatmaps
Perhaps the most fascinating feature of Microsoft Clarity are the heatmaps. If you are an experienced SEO specialist you are probably familiar with similar tools like Hotjar or Crazyegg. Heatmaps and click maps are a great way to understand to which elements on your page a visitor is attracted and if he goes to those areas on a page you want him to go to. Again: the functionality in Microsoft Clarity is not as detailed and elaborated as it is the case in the aforementioned premium tools. But it can be a big help because you can view heatmaps for desktop, tablet and mobile devices.
Linking Microsoft Clarity to Google Analytics
You can link Microsoft Clarity to your Google Analytics account. Simply go to Settings and select Setup in the left menu. If you scroll to the bottom of the page, simply activate the Google Analytics integration and select the site to connect. Once connected, it will create a custom dimension in your Google Analytics report called ‘Clarity Playback URL’. Do note that at the time of writing you can only link to one web property.
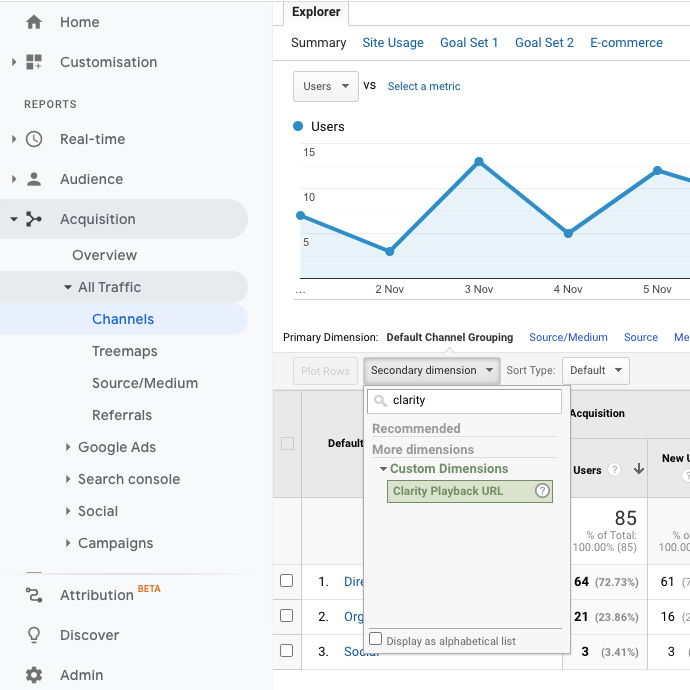
Wrapping up
Microsoft Clarity offers a lot of features and tools that other premium website analytics tools offer too. There is some overlap between Google Analytics and Hotjar/Crazyegg as far as the metrics are concerned for the former and the heat maps for the latter. But you shouldn’t replace any of these tools completely. While Microsoft Clarity has elements for free for which you have to pay at other services, it remains rather limited on multiple fronts. Although extra features will likely be added in the future, the best way to proceed is to roll it out on top or alongside other existing premium site analytics tools. This can give you extra metrics and reports to make comparisons and to make informed strategic decisions.